High Performance Charts for the Web.
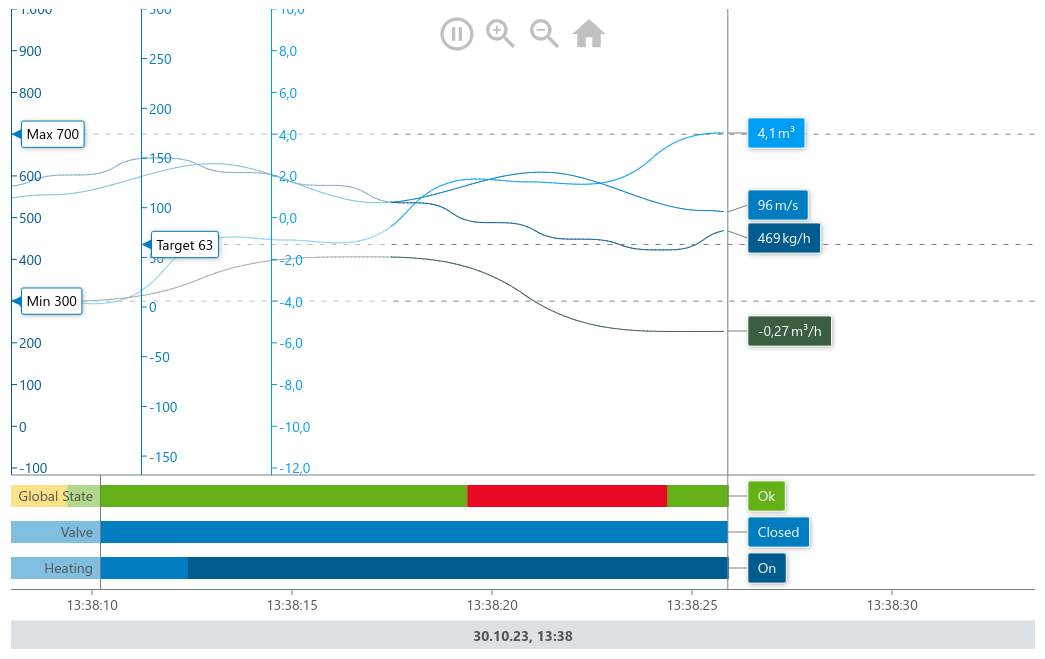
This is an example of our Timeline Chart. See the implementation here.
Features
High Performance
Meistercharts renders all charts in a HTML canvas. This makes it possible to render thousands of data points in a few milliseconds
Built with Kotlin
Meistercharts is built with Kotlin and compiled to Javascript. We provide a javascript library and a react wrapper via npm.
Extensible
The charts are composed of multiple layers on the canvas. Using these layers we can create any chart type you can imagine.
Open Source
Meistercharts is completely open source. You can find the source code on GitHub. Contact us if you have special use cases and need more chart types