Timeline Chart
Visualize changing values over time
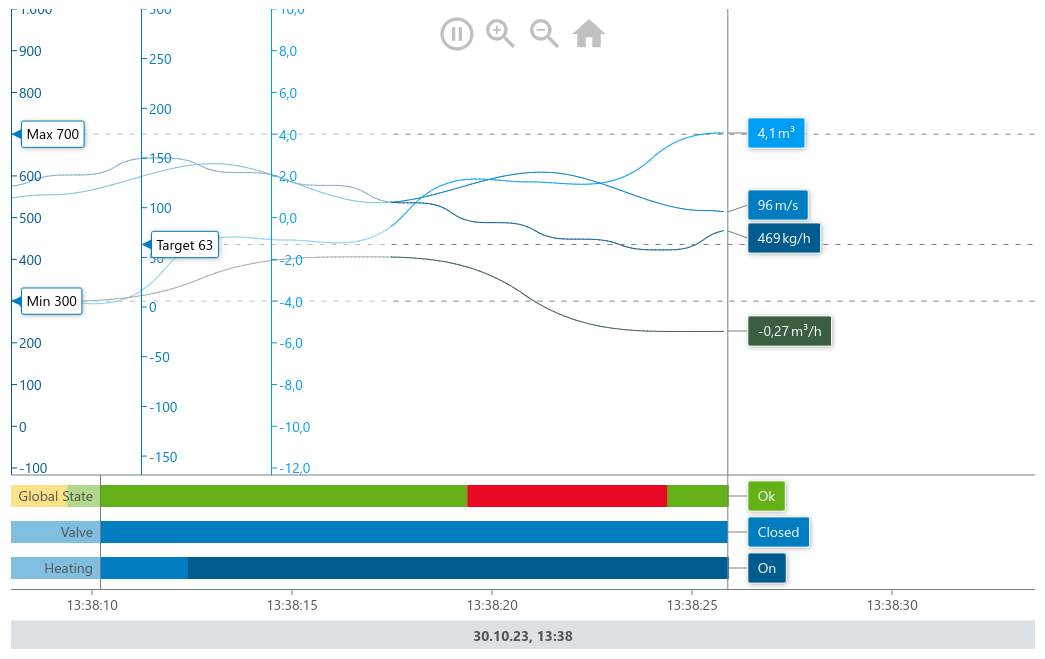
Basic Implementation
The Timeline Chart is our most complex chart and is comprised of two elements:
TimeLineChartcomponent:
This is the actual component, that renders the chart. You can configure the chart with theconfigurationprop.useTimeLineChartControllerhook:
This hook exposes methods to control the chart behavior at runtime and has to be passed into the chart component via thecontrollerprop.
import { TimeLineChart, useTimeLineChartController } from "@meistercharts/meistercharts-react";

export function MyChart() {
  const controller = useTimeLineChartController();

  const config = {
    /* Chart Configuration Object */
  };

  return <TimeLineChart configuration={config} controller={controller} />;
}Display your own values
There are two steps necessary in order to display your own data in the Timeline chart:
- Define the data series
- Add samples to the chart’s history
Define Data Series
The timeline chart can display two different types of data: decimal values (e.g. the flow rate through a pipe) and enum values (e.g. the state of a valve). Each data series has to be defined in the dataSeries property of the chart’s configuration object.
const config = {
  decimalDataSeries: DecimalDataSeries[],
  enumDataSeries: EnumDataSeries[],
  ...
}
See the definition of the DecimalDataSeries and EnumDataSeries types in the reference.
Add Samples
Once the data series are defined, you can add values to each of the data series using the addSample or addSamples methods of the chart’s controller.
The id in the sample object has to match the id of the data series, that you want to add the sample to.
Example
function MyChart() {
  const controller = useTimeLineChartController();

  const config = {
    decimalDataSeries: [{ id: 0, name: "Flow Rate" }],
    enumDataSeries: [
      {
        description: "valve state",
        values: [
          { ordinal: 0, label: "closed" },
          { ordinal: 1, label: "open" },
        ],
      },
    ],
  };

  useEffect(() => {
    const timer = setInterval(() => {
      // ... fetch data from the backend
      controller.addSample(
        {
          timestamp: Date.now(),
          decimalValues: [data.flowRate],
          enumValues: [data.valveState],
        },
        500,
      );
    });

    return () => clearInterval(timer);
  }, []);

  return <TimeLineChart controller={controller} configuration={config} />;
}useTimeLineChartController
This hook returns a controller object, that exposes methods to control the chart behavior at runtime. To connect the controller to the chart, you have to pass it into the chart component via the controller prop.
| Method | Description |
|---|---|
setUpDemo | Sets up a demo chart with random data. |
addSample | Adds a new sample to the chart. |
addSamples | Adds multiple samples to the chart. |
clearHistory | Clears the chart history. |
getVisibleTimeRange | Returns the current visible time range. |
getZoom | Returns the current zoom level. |
modifyZoom | Set the chart’s zoom level. |
pause | Pause the moving time axis. |
play | Start the moving time axis. |
resetView | Reset the chart’s view to the default values. |
setUpDemo()
Sets up the timelinc chart with sample data series and data. This is only useful for demonstration purposes.
addSample
Adds a new Sample to the chart’s internal history.
controller.addSample(sample: Sample)addSamples
Adds multiple Samples to the chart’s internal history.
controller.addSamples(samples: Sample[])clearHistory
Clears the chart history. All previously added values will be removed from the chart.
controller.clearHistory();getVisibleTimeRange
Returns the current visible time range of the chart (in UTC).
const timeRange = controller.getVisibleTimeRange();This method returns a TimeRange Object.
getZoom
Returns the current zoom level of the chart.
const zoom = controller.getZoom();This method returns a Zoom Object.
modifyZoom
Modify the current zoom level of the chart.
controller.modifyZoom(zoom: Zoom, zoomCenterX: number, zoomCenterY: number)The zoom- Parameter is a Zoom Object.
pause
Stop moving the time axis. New data can still be added, but the time axis will no longer move and the new data will not be visible.
controller.pause();play
Resume moving the time axis. The chart will jump to the latest data points that were added.
controller.play();resetView
Reset zoom and translation.
controller.resetView();Chart Configuration
The timeline chart accepts a configuration object with the following properties:
| Property | Value | Description |
|---|---|---|
decimalDataSeries | DecimalDataSeries[] | The decimal data series that should be displayed in the chart. |
enumDataSeries | EnumDataSeries[] | The enum data series that should be displayed in the chart. |
style | TimeLineChartStyle | The style of the chart. |
historySettings | HistorySettings | The settings for the chart’s history. |