Getting started
Create your first chart using Javascript.
Installation
The Meistercharts package can be install from npmjs.com with a package manager of your choice.
npm
npm install @meistercharts/meisterchartsyarn
yarn add @meistercharts/meisterchartspnpm
pnpm add @maistercharts/meisterchartsRender your first chart
First you need to create a container that will hold your chart and give it a unique ID.
<div id="timeLineChart"></div>Then inside javascript you can create a chart instance and connect it to the container you created in the first step.
const meisterCharts = require('@meistercharts/meistercharts/meistercharts-easy-api')

// create chart instance
const chart = meisterCharts.createTimeLineChartFromId('timeLineChart')
Next you can display some sample data in your new Timeline Chart:
chart.setUpDemo()Now you should see a chart like the following on your screen:
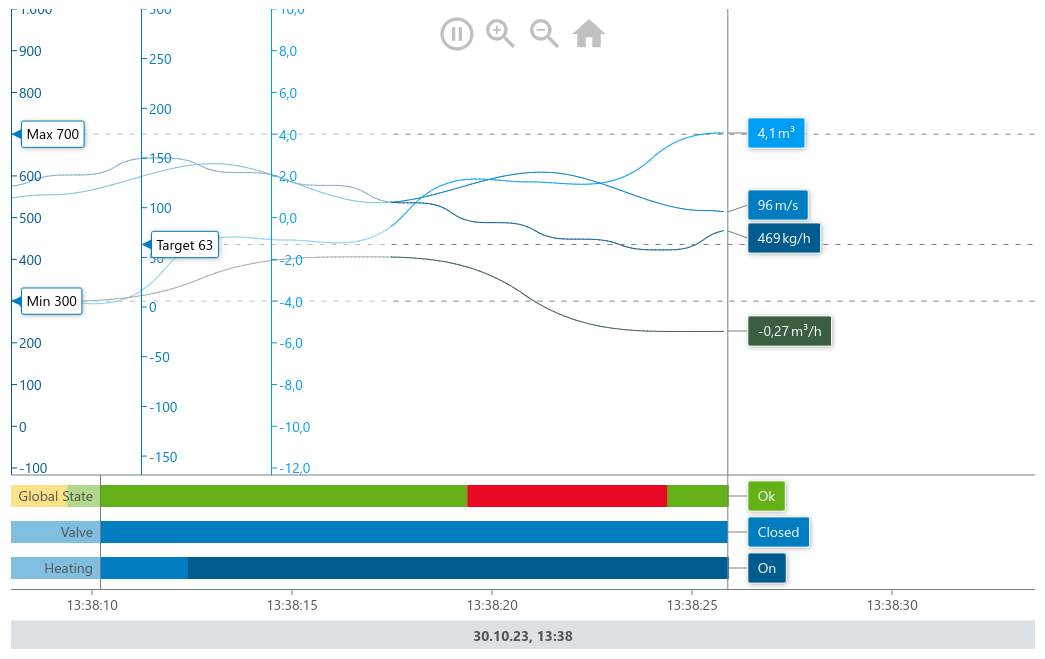
If you cannot see the chart, make sure that your container div has a height.
<div id="timeLineChart" style="height:768px;"></div>Learn more about how to visualize your own data and how to configure the chart’s style on the documentation page for the Timeline Chart
Dispose of the chart
Once the chart is not needed anymore you should dispose of it to prevent memory leaks.
chart.dispose()On this page