JavaScript
Histogram
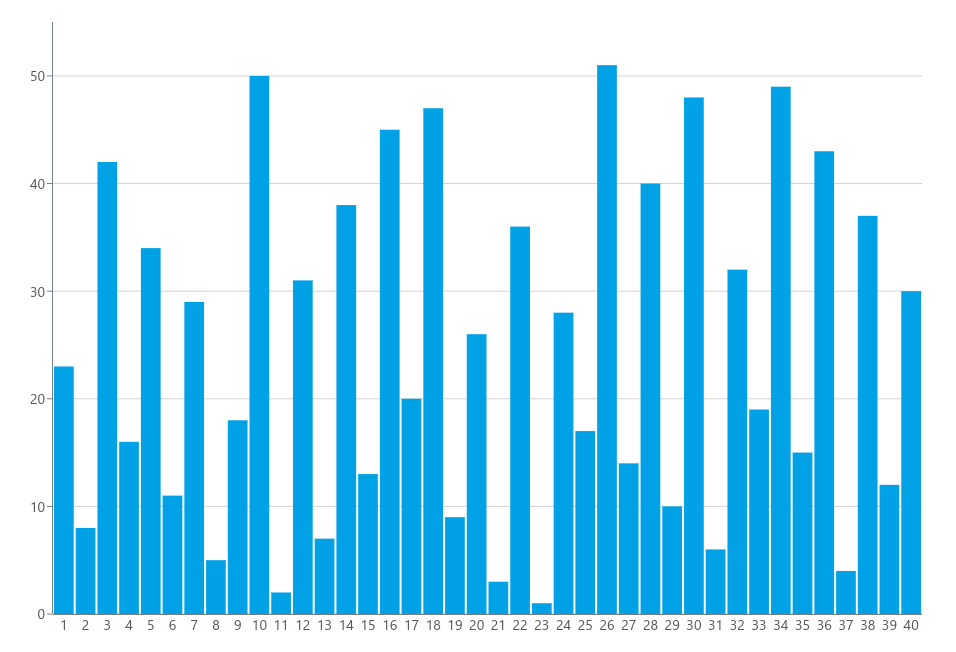
Visualize a longer set of single values.
Basic Implementation
To render a histogram chart, you first have to set up a container in your HTML.
<div id="histogram"></div>Next in your script file, you need to import the meistercharts package and create a new instance of the histogram chart.
const meistercharts = require("@meistercharts/meistercharts/meistercharts-easy-api");

const chart = meistercharts.createHistogramFromId("barChartStacked");
This will render an empty chart with the default styles.
Add data to the chart
To add data to the chart, you need to call the setData- function on the chart instance with your data.
chart.setData({
  categories: [
    { label: "1", values: [23] },
    { label: "2", values: [8] },
    // ...
    { label: "39", values: [12] },
    { label: "40", values: [30] },
  ],
});
The setData- function will accept an object of the type HistogramData.
Customize the chart style
You can customize how the chart looks by calling the setStyle- function on the chart instance.
chart.setStyle({
  barGap: 5,
  barSize: 20,
  // ...
});
The setStyle function accepts an object of the type HistogramStyle.