JavaScript
Line Chart Simple
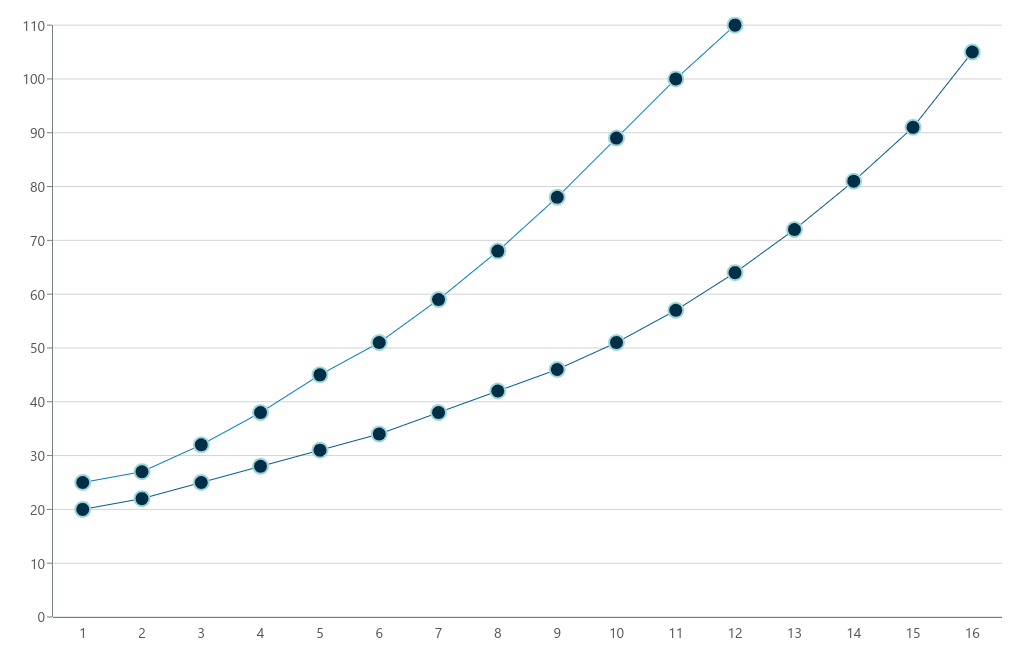
Visualize a series of data points connected by straight line segments.
Basic Implementation
To render a simple line chart, you first have to set up a container in your HTML.
<div id="lineChartSimple"></div>Next in your script file, you need to import the meistercharts package and create a new instance of the line chart.
const meistercharts = require("@meistercharts/meistercharts/meistercharts-easy-api");

const chart = meistercharts.createLineChartSimpleFromId("lineChartSimple");
This will render an empty chart with the default styles.
Add data to the chart
To add data to the chart, you need to call the setData- function on the chart instance with your data.
chart.setData({
  categories: [
    { label: "1", values: [20, 25] },
    { label: "2", values: [22, 27] },
    // ...
    { label: "15", values: [91] },
    { label: "16", values: [105] },
  ],
});
The setData- function will accept an object of the type LineChartSimpleData.
Customize the chart style
You can customize how the chart looks by calling the setStyle- function on the chart instance.
chart.setStyle({
  showTooltip: true,
  thresholds: [{ label: "max allowed", value: 100 }],
  // ...
});
The setStyle function accepts an object of the type LineChartSimpleStyle.