React
Bullet Chart
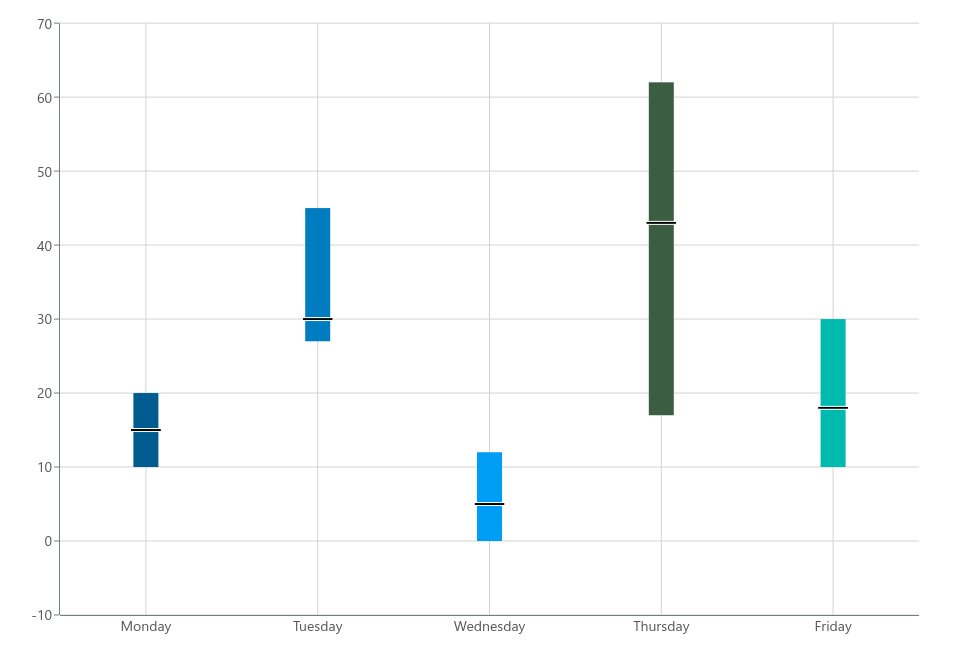
Visualize values with an error range.
Basic Implementation
To render a Bullet Chart, import the BulletChart component.
The following implementation will generate the compass you can see in the image above:
import { BulletChart } from "@meistercharts/meistercharts-react";

export function MyChart() {
  const config = {
    categories: [
      { current: 15, barStart: 10, barEnd: 20, label: "Monday" },
      { current: 30, barStart: 27, barEnd: 45, label: "Tuesday" },
      { current: 5, barStart: 0, barEnd: 12, label: "Wednesday" },
      { current: 43, barStart: 17, barEnd: 62, label: "Thursday" },
      { current: 18, barStart: 10, barEnd: 30, label: "Friday" },
    ],
  };

  return <BulletChart configuration={config} />;
}
For improved performance you should initialize the chart configuration inside a useMemo hook.
Chart Configuration
The data as well as the compass style is configurable via the configuration prop. It accepts a BulletChartConfiguration object.
On this page