JavaScript
Bar Chart Stacked
Visualize portions of data that are part of a whole.
Basic Implementation
To render a stacked bar chart, you first have to set up a container in your HTML.
<div id="barChartStacked"></div>Next in your script file, you need to import the meistercharts package and create a new instance of a bar chart.
const meistercharts = require("@meistercharts/meistercharts/meistercharts-easy-api");

const chart = meistercharts.createBarChartStackedFromId("barChartStacked");
This will render an empty chart with the default styles.
Add data to the chart
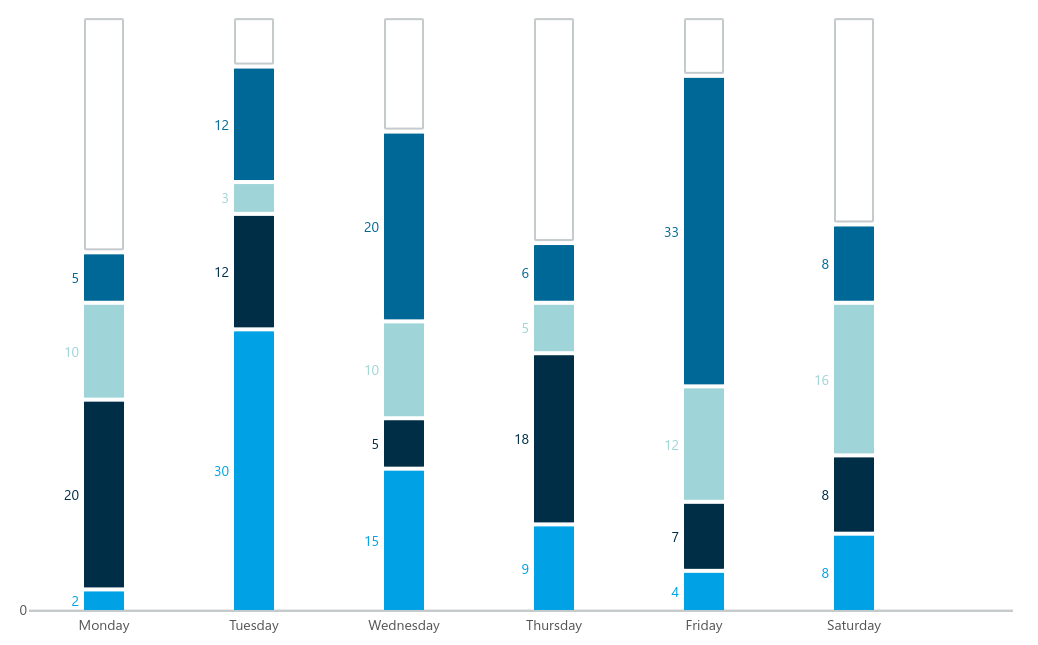
To add data to the chart, you need to call the setData- function on the chart instance with your data.
chart.setData({
  categories: [
    { label: "Monday", values: [2, 20, 10, 5] },
    { label: "Tuesday", values: [30, 12, 3, 12] },
    { label: "Wednesday", values: [15, 5, 10, 20] },
    { label: "Thursday", values: [9, 18, 5, 6] },
    { label: "Friday", values: [4, 7, 12, 33] },
    { label: "Saturday", values: [8, 8, 16, 8] },
  ],
});
The setData- function will accept an object of the type BarChartStackedData.
Customize the chart style
You can customize how the chart looks by calling the setStyle- function on the chart instance.
chart.setStyle({
  barWidth: 25,
  valueRange: {
    start: 0,
    end: 60,
  },
  // ...
});
The setStyle function accepts an object of the type BarChartStackedStyle.