React
Bar Chart Grouped
Visualize data that is logically grouped by category
Basic Implementation
To render a grouped bar chart, import the BarChartGrouped component.
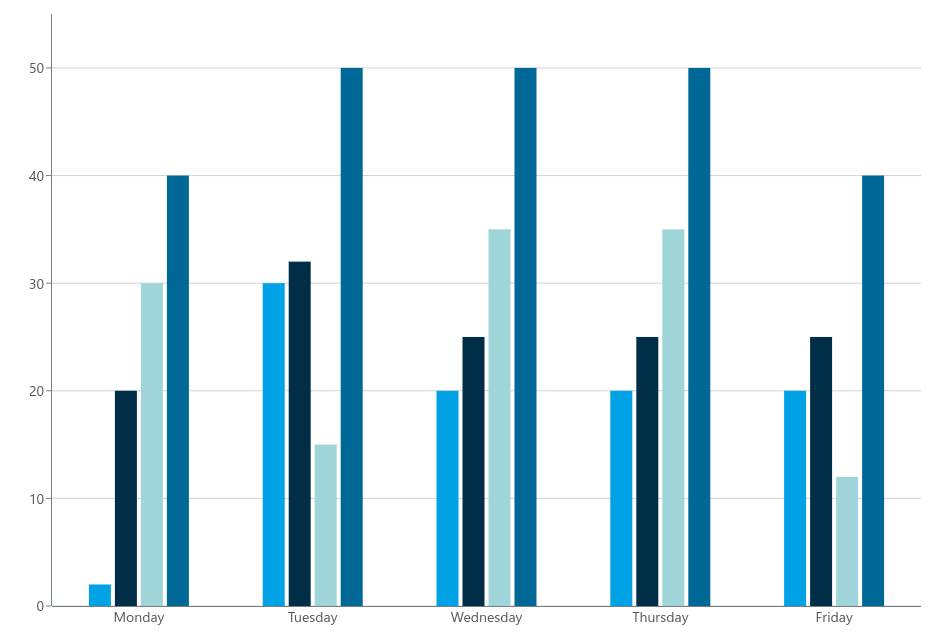
The following implementation will generate the chart you can see in the image above:
import { BarChartGrouped } from "@meistercharts/meistercharts-react";

export function MyChart() {
  const config = {
    data: {
      categories: [
        { label: "Monday", values: [2, 20, 30, 40] },
        { label: "Tuesday", values: [30, 32, 15, 50] },
        { label: "Wednesday", values: [20, 25, 35, 50] },
        { label: "Thursday", values: [20, 25, 35, 50] },
        { label: "Friday", values: [20, 25, 12, 40] },
      ],
    },
  };

  return <BarChartGrouped configuration={config} />;
}
For improved performance you should initialize the chart configuration inside a useMemo hook.
Chart Configuration
The data as well as the chart style is configurable via the configuration prop. It accepts an object with the following properties:
| Property | Value | Description |
|---|---|---|
data | BarChartData | The data to be rendered in the chart. |
style? | BarChartGroupedStyle | Style options for the chart. |
On this page