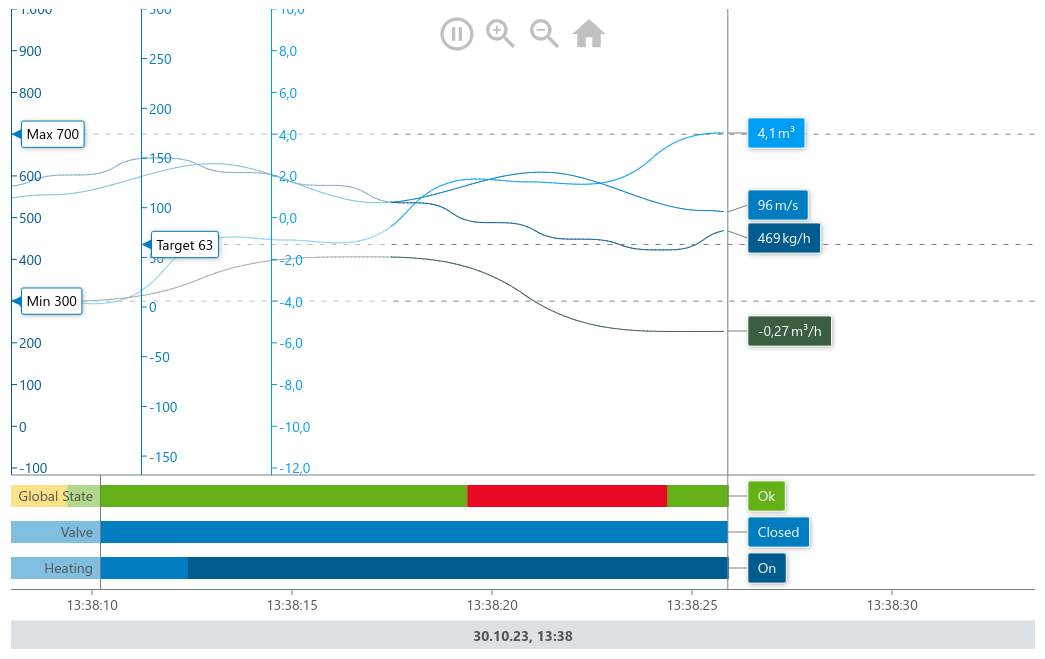
Timeline Chart
Visualize changing values over time
Basic Implementation
To render a timeline chart, you first have to set up a container in your HTML.
<div id="timeLineChart"></div>Next in your script file, you need to import the meistercharts package and create a new instance of the timeline chart.
const meistercharts = require('@meistercharts/meistercharts/meistercharts-easy-api')

const chart = meistercharts.createTimeLineChartFromId('timeLineChart')
This will render an empty chart with the default styles.
You can have meistercharts create some sample data for demonstration purposes by calling the setUpDemo- function on the chart instance.
chart.setUpDemo()Display your own values
There are two steps necessary in order to display your own data in the Timeline chart:
- Define the data series
- Add samples to the chart’s history
Define Data Series
The timeline chart can display two different types of data: decimal values (e.g. the flow rate through a pipe) and enum values (e.g. the state of a valve). Each data by calling the setDataSeries- function on the chart instance.
chart.setDataSeries(DecimalDataSeries[], EnumDataSeries[])See the definition of the DecimalDataSeries and EnumDataSeries types in the reference.
Add Samples
Once the data series are defined, you can add values to each of the data series using the addSample or addSamples methods.
The id in the sample object has to match the id of the data series, that you want to add the sample to.
Example
<div id="timeLineChart"></div>

<script>
  const meistercharts = require('@meistercharts/meistercharts/meistercharts-easy-api')

  const chart = meistercharts.createTimeLineChartFromId('timeLineChart')

  chart.setDataSeries(
    [{ id: 0, name: 'Flow Rate' }],
    [
      {
        description: 'valve state',
        values: [
          { ordinal: 0, label: 'closed' },
          { ordinal: 1, label: 'open' }
        ]
      }
    ]
  )

  setInterval(() => {
    // ... fetch data from somewhere
    chart.addSample({
      timestamp: Date.now(),
      decimalValues: [data.flowRate],
      enumValues: [data.valveState]
    })
  }, 100)
</script>
Controlling the chart
The timeline chart instance exposes the following methods to control the chart:
| Method | Description |
|---|---|
setData | Modify the history settings and play/pause the chart. |
setStyle | Modify the chart style. |
getVisibleTimeRange | Returns the current visible time range. |
setDataSeries | Configures the data series to be shown in the chart. |
addSample | Adds a new sample to the chart. |
addSamples | Adds multiple samples to the chart. |
addSamplesDirecty | Adds samples to the history stored by this chart. |
clearHistory | Clears the chart history. |
resetView | Reset the chart’s view to the default values. |
getZoom | Returns the current zoom level. |
modifyZoom | Set the chart’s zoom level. |
setUpDemo | Sets up a demo chart with preconfigured data. |
setData
Modify the history settings and play/pause the chart.
chart.setData({
  historySettings: HistorySettings,
  play: boolean
})
See the TimeLineChartData type in the reference for all available options.
setStyle
Modify the chart style.
chart.setStyle(TimeLineChartStyle)See the TimeLineChartStyle type in the reference.
getVisibleTimeRange
Returns the current visible time range (TimeRange).
const visibleTimeRange = chart.getVisibleTimeRange()setDataSeries
Configures the data series to be shown in the chart. This method has to be called before adding samples to the chart.
chart.setDataSeries(DecimalDataSeries[], EnumDataSeries[])Accepts an array of DecimalDataSeries and EnumDataSeries objects.
addSample
Adds a new Sample to the chart’s internal history.
chart.addSample(sample: Sample)addSamples
Adds an array of Samples to the chart’s internal history.
chart.addSamples(samples: Sample[])addSamplesDirectly
Adds samples to the history stored by this chart. Uses the given distance between samples to calculate the sampling period.
chart.addSamplesDirectly(samples: Sample[], durationBetweenSamples: number)clearHistory
Clears the chart history.
chart.clearHistory()resetView
Reset the chart’s view to the default values.
chart.resetView()getZoom
Returns the current Zoom level.
const zoom = chart.getZoom()modifyZoom
Set the chart’s zoom level.
chart.modifyZoom(zoom?: Zoom, zoomCenterX?: number, zoomCenterY?: number)setUpDemo
Sets up the timelinc chart with sample data series and data. This is only useful for demonstration purposes.
chart.setUpDemo()