JavaScript
Bar Chart Grouped
Visualize data that is logically grouped by category
Basic Implementation
To render a grouped bar chart, you first have to set up a container in your HTML.
<div id="barChartGrouped"></div>Next in your script file, you need to import the meistercharts package and create a new instance of a bar chart.
const meistercharts = require('@meistercharts/meistercharts/meistercharts-easy-api')

const chart = meistercharts.createBarChartGroupedFromId('barChartGrouped')
This will render an empty chart with the default styles.
Add data to the chart
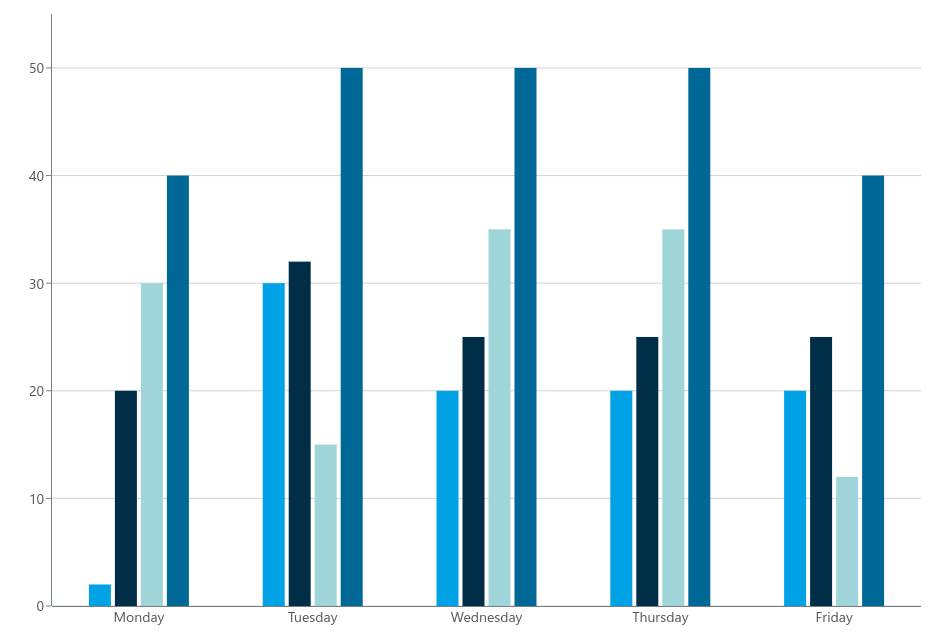
To add data to the chart, you need to call the setData- function on the chart instance with your data.
chart.setData({
  categories: [
    { label: 'Monday', values: [2, 20, 30, 40] },
    { label: 'Tuesday', values: [30, 32, 15, 50] },
    { label: 'Wednesday', values: [20, 25, 35, 50] },
    { label: 'Thursday', values: [20, 25, 35, 50] },
    { label: 'Friday', values: [20, 25, 12, 40] }
  ]
})
The setData- function will accept an object of the type BarChartGroupedData.
Customize the chart style
You can customize how the chart looks by calling the setStyle- function on the chart instance.
chart.setStyle({
  barGap: 5,
  barSize: 20
  // ...
})
The setStyle function accepts an object of the type BarChartGroupedStyle.