JavaScript
Bullet Chart
Visualize values with an error range.
Basic Implementation
To render a bullet chart, you first have to set up a container in your HTML.
<div id="bulletChart"></div>
Next in your script file, you need to import the meistercharts package and create a new instance of the bullet chart.
const meistercharts = require('@meistercharts/meistercharts/meistercharts-easy-api')

const chart = meistercharts.createBulletChartFromId('bulletChart')
This will render an empty chart with the default styles.
Add data to the chart and customize the style
In the bullet chart the setData and setStyle functions are combined into setConfiguration.
To add data to the chart, you need to call the setConfiguration- function on the chart instance with your data.
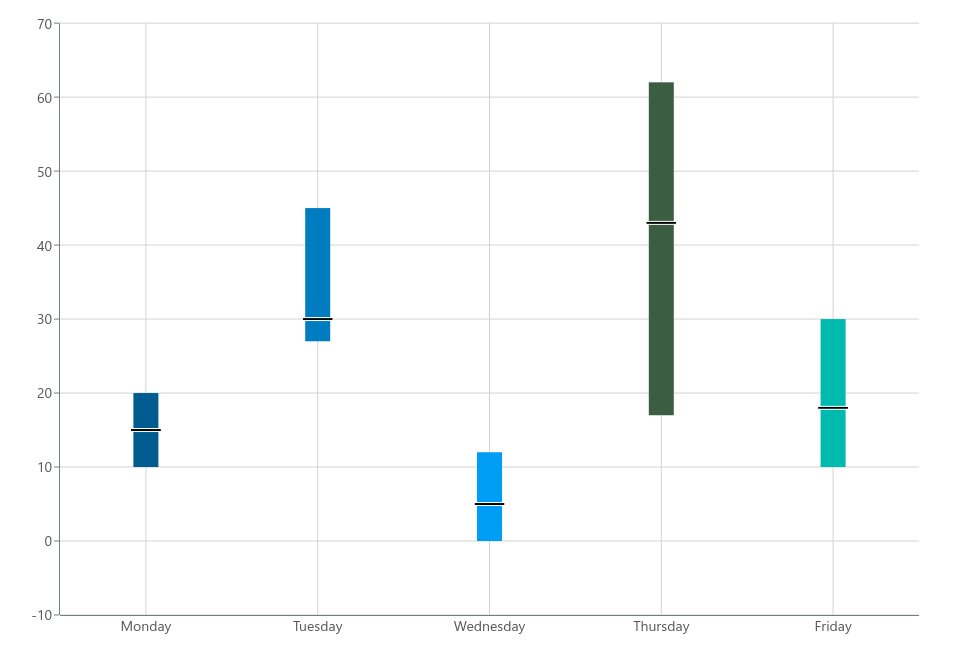
chart.setConfiguration({
  categories: [
    { current: 15, barStart: 10, barEnd: 20, label: 'Monday' },
    { current: 30, barStart: 27, barEnd: 45, label: 'Tuesday' },
    { current: 5, barStart: 0, barEnd: 12, label: 'Wednesday' },
    { current: 43, barStart: 17, barEnd: 62, label: 'Thursday' },
    { current: 18, barStart: 10, barEnd: 30, label: 'Friday' }
  ]
})
To style the chart, you can pass in the style options into setConfiguration as well.
chart.setConfiguration({
  categories: [
    { current: 15, barStart: 10, barEnd: 20, label: 'Monday' },
    { current: 30, barStart: 27, barEnd: 45, label: 'Tuesday' },
    { current: 5, barStart: 0, barEnd: 12, label: 'Wednesday' },
    { current: 43, barStart: 17, barEnd: 62, label: 'Thursday' },
    { current: 18, barStart: 10, barEnd: 30, label: 'Friday' }
  ],
  barSize: 20,
  showTooltip: false
  // ...
})
The setConfiguration- function will accept an object of the type BulletChartConfiguration.