JavaScript
Compass
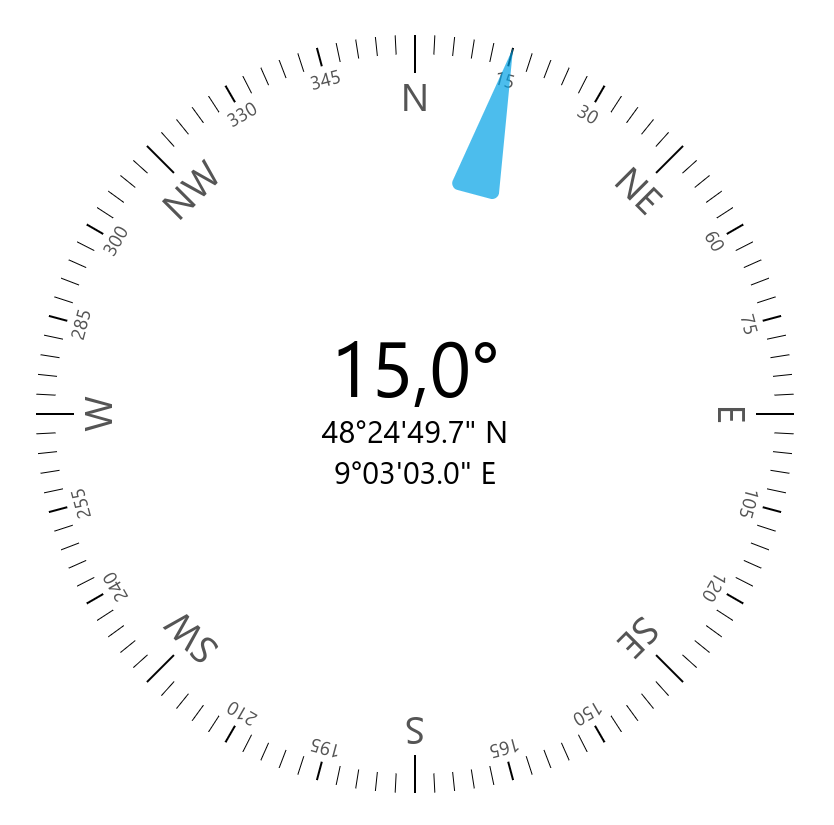
Display a heading on a compass along with the latitude and longitude.
Basic Implementation
To render the compass, you first have to set up a container in your HTML.
<div id="compass"></div>Next in your script file, you need to import the meistercharts package and create a new instance of the compass.
const meistercharts = require('@meistercharts/meistercharts/meistercharts-easy-api')

const chart = meistercharts.createCompassFromId('compass')
This will render an empty compass with the default styles.
Add data to the chart
To add data to the compass, you need to call the setData- function on the chart instance with your data.
chart.setData({
  currentValue: 15,
  labelLatitude: '48°24\'49.7" N',
  labelLongitude: '9°03\'03.0" E'
})
The setData- function will accept an object of the type CompassData.
Customize the chart style
You can customize how the chart looks by calling the setStyle- function on the chart instance.
chart.setStyle({
  barWidth: 25,
  valueRange: {
    start: 0,
    end: 60
  }
  // ...
})
The setStyle function accepts an object of the type CompassStyle.