React
Getting started
How to create your first chart using React.
Installation
Meistercharts can be installed from npmjs.com with any package manager.
npm
npm install @meistercharts/meistercharts-reactyarn
yarn add @meistercharts/meistercharts-reactpnpm
pnpm add @maistercharts/meistercharts-reactTypescript: The package also includes all necessary type definitions for Typescript.
Render your first chart
Create a react component with the following implementation:
import {
TimeLineChart,
useTimeLineChartController
} from '@meistercharts/meistercharts-react'
export function Chart() {
const controller = useTimeLineChartController()
useEffect(() => {
controller.setUpDemo()
controller.play()
})
return <TimeLineChart controller={controller} />
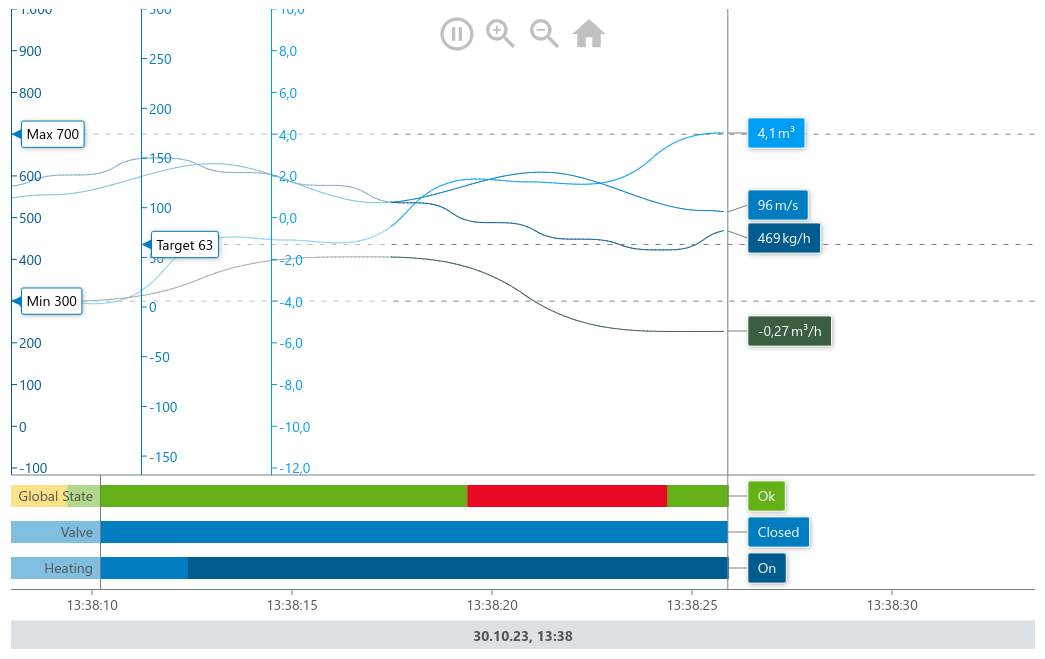
}This will create a new instance of the timeline chart, set up some dummy data for demonstration and start to display this data.
Learn more about how to show your own data and configure the chart on the documentation page for the Timeline Chart.
On this page