React
Line Chart Simple
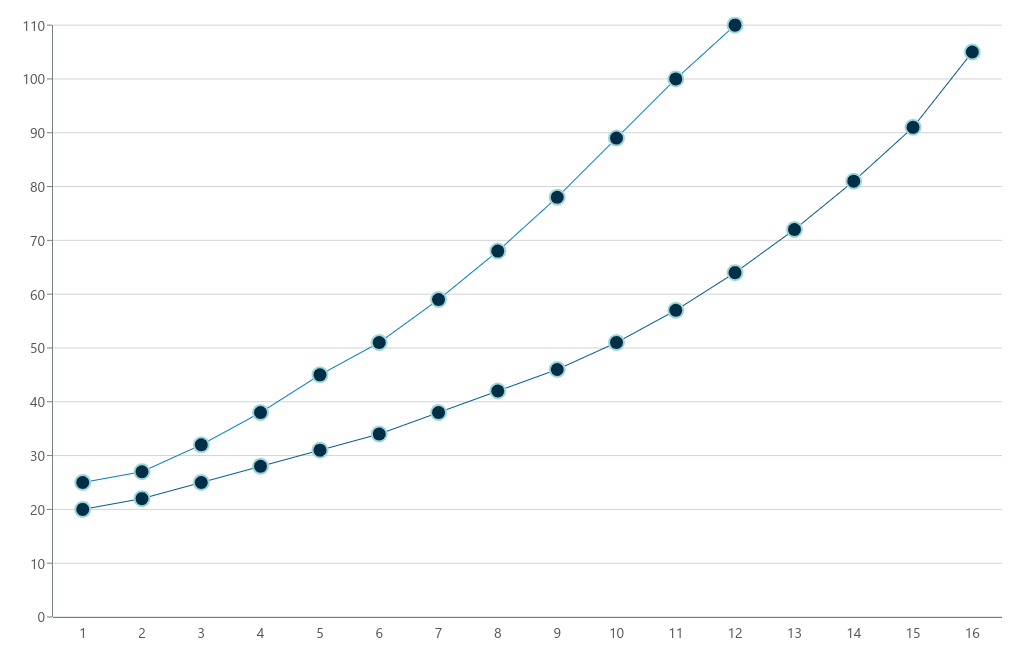
Visualize a series of data points connected by straight line segments.
Basic Implementation
To render a simple line chart, import the LineChartSimple component.
The following implementation will generate the chart you can see in the image above:
import { LineChartSimple } from '@meistercharts/meistercharts-react'

export function MyChart() {
  const config = {
    data: {
      categories: [
        { label: '1', values: [20, 25] },
        { label: '2', values: [22, 27] },
        // ...
        { label: '15', values: [91] },
        { label: '16', values: [105] }
      ]
    }
  }

  return <LineChartSimple configuration={config} />
}
For improved performance you should initialize the chart configuration inside a useMemo hook.
Chart Configuration
The data as well as the chart style is configurable via the configuration prop. It accepts an object with the following properties:
| Property | Value | Description |
|---|---|---|
data | LineChartSimpleData | The data to be rendered in the chart. |
style? | LineChartSimpleStyle | Style options for the chart. |
On this page