React
Histogram
Visualize a longer set of single values.
Basic Implementation
To render a histogram, import the Histogram component.
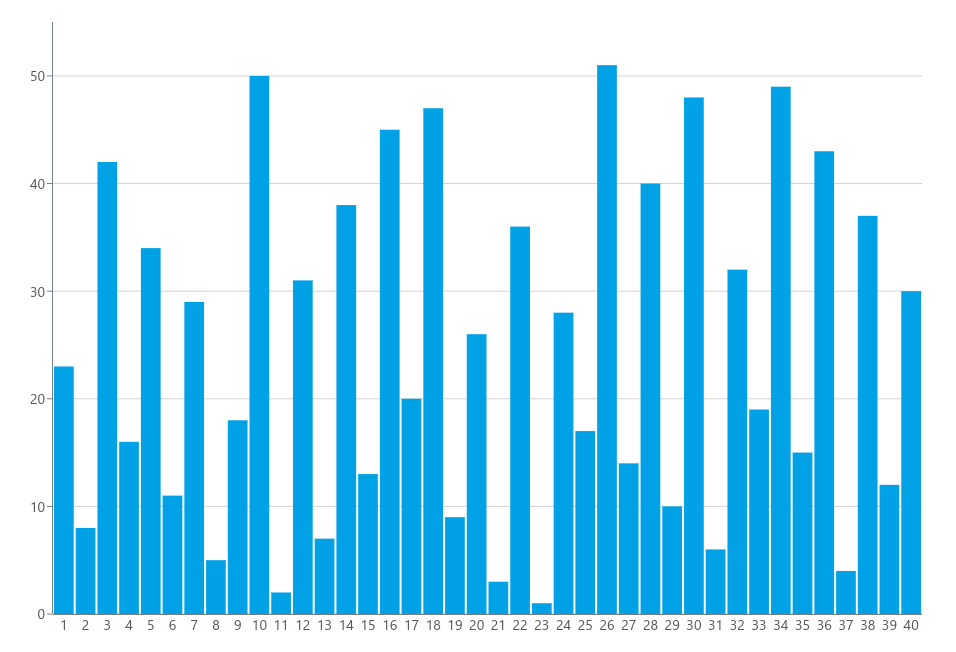
The following implementation will generate the chart you can see in the image above:
import { Histogram } from '@meistercharts/meistercharts-react'

export function MyChart() {
  const config = {
    data: {
      categories: [
        { label: "1", values: [23] },
        { label: "2", values: [8] },
        // ...
        { label: "39", values: [12] },
        { label: "40", values: [30] },
      ],
  }

  return <Histogram configuration={config} />
}
For improved performance you should initialize the chart configuration inside a useMemo hook.
Chart Configuration
The data as well as the chart style is configurable via the configuration prop. It accepts an object with the following properties:
| Property | Value | Description |
|---|---|---|
data | HistogramData | The data to be rendered in the chart. |
style? | HistogramStyle | Style options for the chart. |
On this page